Last Updated -

June 4, 2026

Tesla

Company Profile and Market Insights

Explore the business model, global strategy, and market performance including insights into its position in China.

Tesla
Key facts
Founded 2003 • NASDAQ: TSLA • Q1 2026 results (Mar 31, 2026 quarter)
$22.387b
Q1 2026 revenue
$941m
Q1 2026 operating income
$1.444b
Q1 2026 free cash flow
358,023
Q1 2026 deliveries
1.28m
Active FSD subscriptions
$44.743b
Cash & short-term investments

About

Tesla, Inc. was founded in 2003 and is headquartered in Austin, Texas. The company designs, manufactures, sells and leases fully electric vehicles, energy generation and storage systems, charging infrastructure and related software and services. Its main products include Model 3, Model Y, Model S, Model X, Cybertruck, Megapack, Powerwall, Superchargers and Full Self-Driving, or FSD, which is driver-assistance software sold through subscriptions and other paid models.

Tesla has developed from a premium electric vehicle maker into one of the world’s largest battery-electric vehicle manufacturers, with disclosed annual automotive capacity of more than 2.25 million units across California, Shanghai, Berlin and Texas. Management frames the company’s long-term purpose around accelerating sustainable energy and building real-world artificial intelligence through FSD, Robotaxi, Cybercab and Optimus humanoid robotics. Its business still depends mainly on vehicle and energy hardware economics, while services, charging, insurance, autonomy software and fleet-based revenue are becoming more important.

In Q1 2026, Tesla generated $22.387 billion in revenue, up 16% year over year, with $16.234 billion from automotive, $2.408 billion from energy generation and storage, and $3.745 billion from services and other activities. Gross profit was $4.720 billion, GAAP net income attributable to common stockholders was $477 million, and free cash flow was $1.444 billion. The company produced 408,386 vehicles, delivered 358,023 vehicles, deployed 8.8 GWh of energy storage, and ended the quarter with 8,463 Supercharger stations, 79,918 Supercharger connectors and $44.743 billion in cash, cash equivalents and short-term investments.

Tesla

Business Model and Market Position

Tesla makes money primarily by designing, manufacturing, selling and leasing electric vehicles, with a growing contribution from energy storage, charging, services, insurance and software subscriptions. In Q1 2026, total revenue was $22.387 billion, up 16% year over year. Automotive remained the core business at $16.234 billion of revenue, while energy generation and storage contributed $2.408 billion and services and other contributed $3.745 billion.

The business is organized around two reportable segments: automotive and energy generation and storage. The automotive segment includes new vehicle sales and leasing, regulatory credits, used vehicles, maintenance and collision services, paid Supercharging, insurance, parts and merchandise. The energy segment includes battery storage products such as Megapack and Powerwall, plus solar and related energy services.

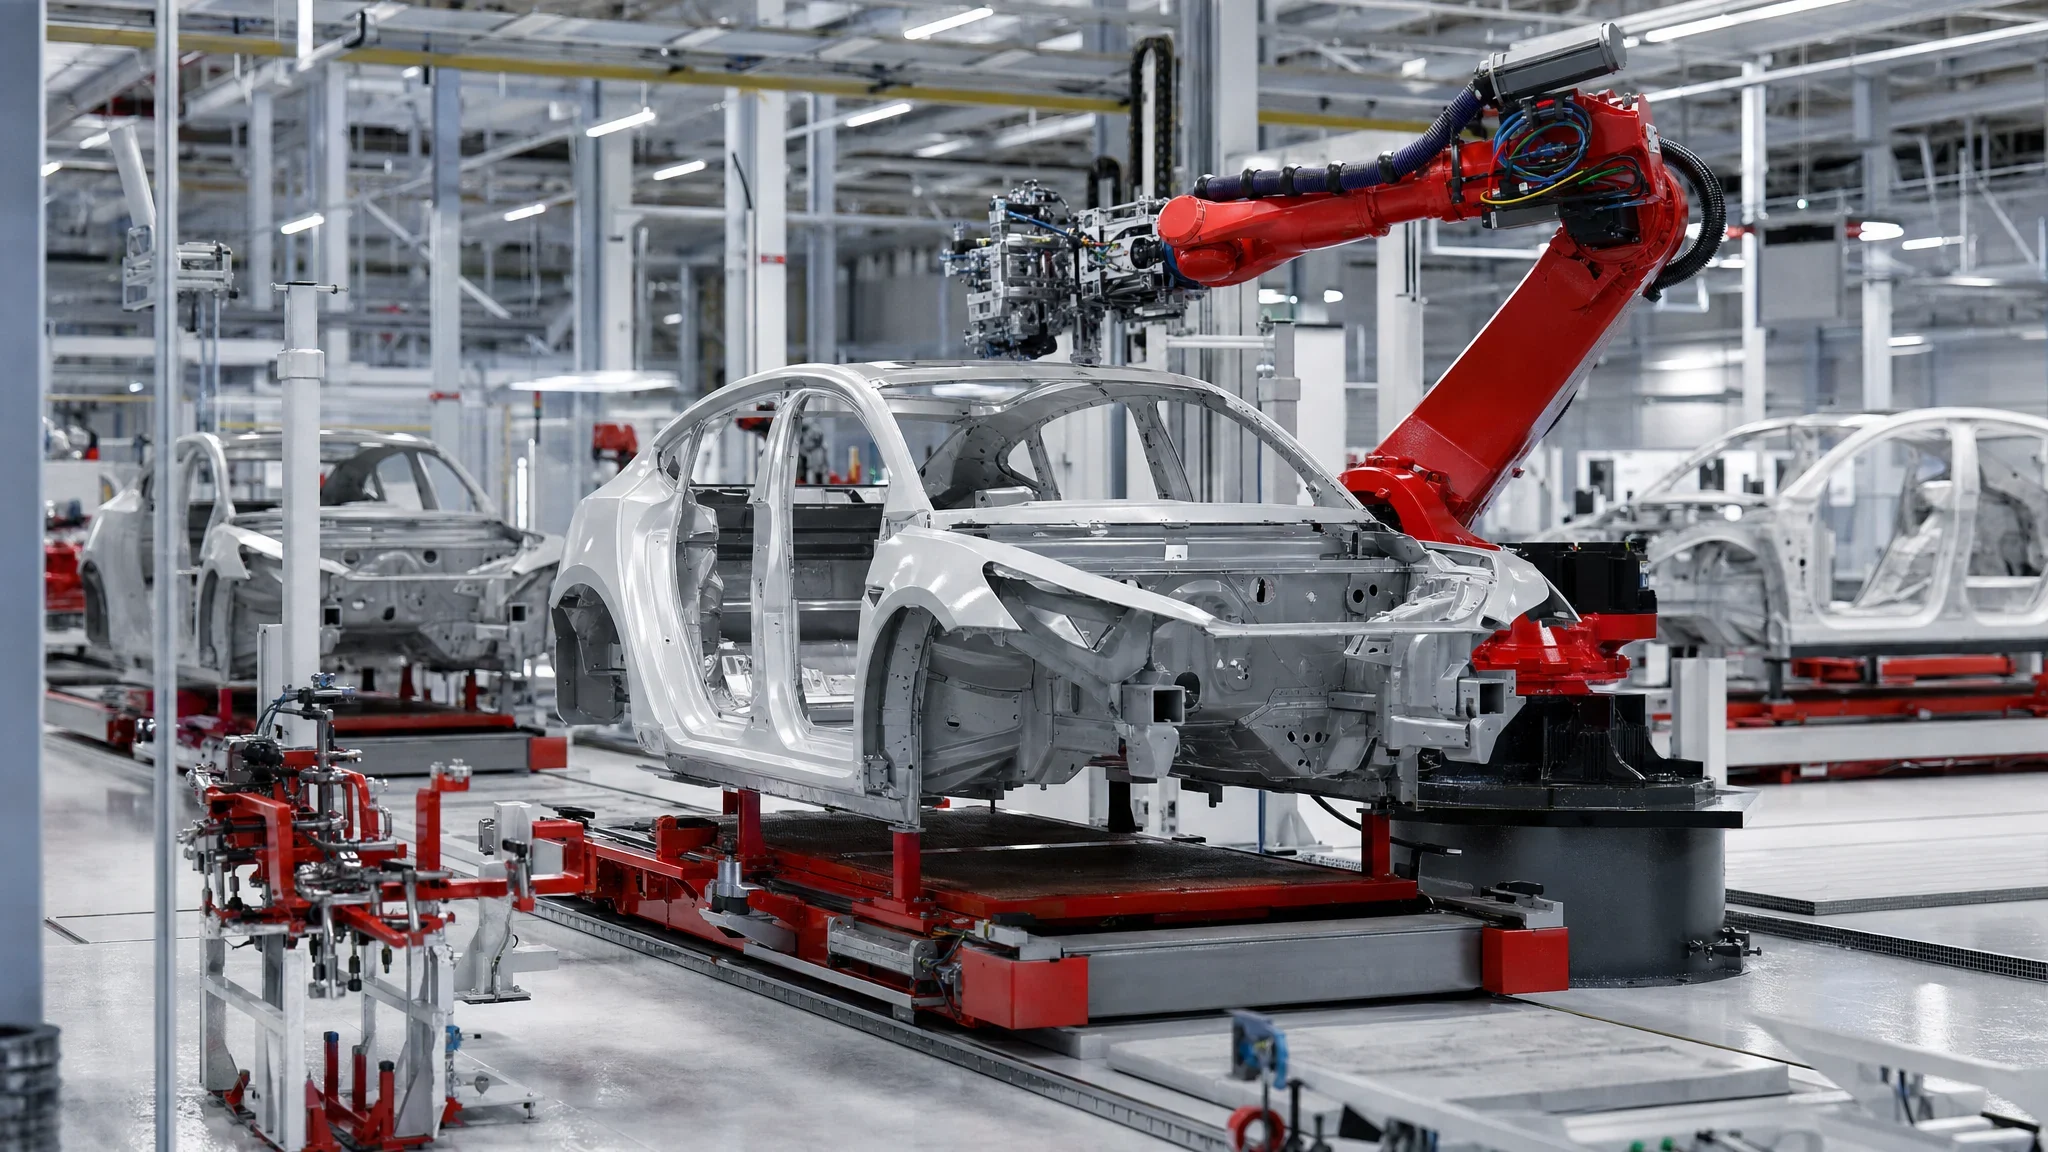
  1. Automotive hardware: Tesla’s main revenue stream is vehicle sales, led by Model 3 and Model Y, with additional products including Cybertruck and planned volume production for Cybercab and Tesla Semi from 2026. In Q1 2026, Tesla produced 408,386 vehicles and delivered 358,023 vehicles.
  2. Energy storage and generation: Tesla sells large-scale and residential energy products, with Megapack and Powerwall central to the segment. Energy storage deployments were 8.8 GWh in Q1 2026. Energy revenue declined year over year in the quarter due to lower deployments, but the segment’s gross margin improved to 39.5%.
  3. Services and other: This category is becoming more important. Q1 2026 revenue rose 42% year over year to $3.745 billion, supported by used vehicle volume, maintenance and collision revenue, paid Supercharging and insurance.
  4. Software and subscriptions: Tesla is increasingly trying to monetize its installed vehicle fleet through FSD subscriptions and future fleet-based services. Active FSD subscriptions reached 1.28 million in Q1 2026, up 51% year over year, and management has said FSD (Supervised) is moving toward a subscription-only model.
  5. Regulatory credits: Automotive regulatory credit revenue remains a high-margin contributor, but it is less reliable than product revenue. In Q1 2026, regulatory credit revenue declined 36% year over year to $380 million.

Tesla’s competitive advantages come from scale, vertical integration, software capability, direct distribution, brand recognition and charging infrastructure. The company disclosed installed annual automotive capacity of more than 2.25 million vehicles across California, Shanghai, Berlin and Texas, excluding pilot or still-to-be-determined programs. Shanghai is the largest disclosed Model 3/Y site, with more than 950,000 units of annual capacity, making China central to Tesla’s manufacturing economics.

The Supercharger network is also a major asset. At the end of Q1 2026, Tesla had 8,463 Supercharger stations and 79,918 connectors. This supports customer adoption, creates paid charging revenue and strengthens Tesla’s position against automakers that rely more heavily on third-party charging networks.

Tesla remains one of the world’s largest battery-electric vehicle manufacturers, but its market position is under pressure from stronger EV competition in the U.S., China and Europe. Direct competitors include BYD, Volkswagen Group, Hyundai Motor Group, General Motors, Ford, BMW, Mercedes-Benz, Nio, XPeng and Li Auto in electric vehicles. In energy storage, Tesla competes with battery suppliers, power equipment companies and system integrators serving utility-scale and residential storage markets.

The most useful peer comparison is BYD in China and globally. Tesla is more concentrated in battery-electric vehicles, software, charging infrastructure and autonomy, while BYD has a broader mass-market vehicle range and deep battery integration. Tesla’s advantage is strongest where its vehicle software, Supercharger network, manufacturing scale and FSD subscription base matter most. BYD and other Chinese automakers create pricing and product-cycle pressure, especially in China, where Tesla generated $4.184 billion of Q1 2026 revenue, equal to about 18.7% of total revenue.

Tesla’s market position increasingly depends on whether it turns its installed fleet and AI investments into recurring, high-margin revenue. Current profitability is still dominated by vehicle and energy hardware economics. Q1 2026 gross margin was 21.1%, operating margin was 4.2% and GAAP net income attributable to common stockholders was $477 million. The balance sheet gives Tesla room to invest, with $44.743 billion in cash, cash equivalents and short-term investments at quarter-end, but the company’s competitive standing now rests on execution across EVs, storage, autonomy, Robotaxi, Cybercab, Semi and Optimus at the same time.

Tesla

Performance in China

China remains one of Tesla’s most important markets and manufacturing bases. Q1 2026 China revenue was $4.184 billion, about 18.7% of total revenue, while FY2025 China revenue was $20.962 billion, broadly flat year over year. Tesla’s local strategy centers on scale manufacturing, localized financing and future software approval. Gigafactory Shanghai produces Model 3 and Model Y and has Tesla’s largest disclosed Model 3/Y annual capacity at more than 950,000 vehicles, supporting China sales and exports. Megafactory Shanghai adds 20 GWh of Megapack capacity, extending Tesla’s China footprint into energy storage. Tesla also has an RMB 40.00 billion China working-capital facility available through April 2028. The main competitive pressure comes from Chinese EV makers and global automakers expanding local EV offerings. A key strategic driver is approval of FSD (Supervised), which remained in progress in Q1 2026 under China’s autonomous-driving and data rules.

Growth and Future Prospects

Tesla entered 2026 with revenue growth, better gross margin, and rising cash generation, while earnings remained modest relative to the scale of the company’s investment program. In Q1 2026, revenue rose 16% year over year to $22.387 billion, gross margin improved to 21.1%, and free cash flow reached $1.444 billion. Operating income was $941 million, equal to a 4.2% operating margin, while GAAP net income attributable to common stockholders was $477 million. Vehicle deliveries were 358,023, below production of 408,386, pointing to inventory and demand-management issues that investors should track.

Key growth drivers

  1. Autonomy and software: Active FSD subscriptions reached 1.28 million in Q1 2026, up 51% year over year. Tesla is moving FSD toward a subscription-heavy model, which would increase recurring revenue if adoption and retention continue to improve.
  2. Robotaxi and Cybercab: Paid Robotaxi miles nearly doubled sequentially in Q1 2026. Tesla launched unsupervised rides in Dallas and Houston in April 2026, after activity in Austin, with other U.S. metros in preparation. Cybercab is planned for volume production starting in 2026.
  3. Energy storage: Energy revenue fell 12% year over year in Q1 2026 due to lower deployments, but segment gross margin improved to 39.5%. Megapack capacity in California and Shanghai, plus Texas capacity under construction, gives Tesla a second large industrial growth platform beyond vehicles.
  4. Services, charging, and fleet economics: Services and other revenue grew 42% year over year to $3.745 billion. The Supercharger network reached 8,463 stations and 79,918 connectors, supporting customer retention, paid charging revenue, and broader infrastructure value.
  5. Vertical integration: Tesla is ramping lithium, cathode, and LFP production, and completed the final design of its AI5 inference processor in April 2026. These initiatives aim to reduce dependency on external suppliers and support AI-enabled products.

Challenges ahead

  1. High execution burden: Tesla is funding vehicle refreshes, Cybercab, Semi, Megapack 3, Optimus, AI compute, battery materials, and semiconductor work at the same time.
  2. Rising capital intensity: Management expects 2026 capital expenditures to exceed $25 billion, led by AI infrastructure, production lines, company-operated AI assets, retail, service, and charging.
  3. Profit volatility: Operating expenses rose 37% year over year in Q1 2026, including a 38% increase in R&D. Other expense of $535 million also weighed on earnings.
  4. China and regulation: China represented 18.7% of Q1 2026 revenue and remains central to Tesla’s manufacturing base. The market also brings strong domestic competition, trade-policy risk, data rules, and unresolved FSD approval.

Tesla’s outlook depends on whether software, autonomy, energy storage, and services scale fast enough to offset pressure in core EV markets and the cost of its AI investment cycle. The balance sheet is strong, with $44.743 billion in cash and short-term investments, giving management room to fund the strategy. The near-term investment case remains tied to execution, regulatory approvals, and proof that new platforms produce durable earnings rather than only higher spending.

This Company Profile was written by Dominik Diemer

Dominik Diemer blends an investor mindset with execution discipline.

He is a SAFe Program Consultant (SPC) and Lean Portfolio Management (LPM) practitioner at DMG MORI Digital, working as a SAFe Release Train Engineer and internal consultant in the Lean-Agile Center of Excellence (LACE).

His focus is prioritization, flow, and dependency management that turns strategy into outcomes. With experience across Bertelsmann and the Founders Foundation, he bridges corporate and startup thinking.

He also invests privately in private equity deals, sharpening his view on business models, value drivers, and go-to-market.

StockCounterParts reflects that lens.