Starbucks makes money through a global coffeehouse platform supported by licensed stores and branded consumer products. The core business is selling beverages, food, and coffee-related products through company-operated stores, while licensed partners operate stores under the Starbucks brand and pay royalties or buy Starbucks products. The company also earns revenue from packaged coffee, ready-to-drink beverages, and other branded products sold through retail and foodservice channels.
In Q2 FY2026, Starbucks generated $9.5 billion of consolidated net revenue, up 9% year over year. Global comparable store sales rose 6.2%, supported by 3.8% transaction growth and 2.3% average ticket growth. The company ended the quarter with 41,129 stores worldwide, split 52% company-operated and 48% licensed.
- Company-operated stores: This is the largest revenue stream and gives Starbucks direct control over pricing, labor, service standards, menu execution, and the customer experience. It also carries the highest exposure to wages, rent, coffee costs, tariffs, and store-level operating volatility.
- Licensed stores: This model expands the brand with lower capital intensity. Starbucks earns royalties, product sales, and brand economics while licensed operators carry more of the store investment and operating burden.
- Channel Development: This segment sells packaged coffee, ready-to-drink products, and other branded consumer products. It is much smaller than store operations but highly profitable, with Q2 FY2026 revenue of $567.8 million and operating margin of 40.5%.
Starbucks reports through North America, International, and Channel Development. North America remains the earnings center of the business, with Q2 FY2026 revenue of $6.9 billion and comparable store sales growth of 7.1%. The U.S. also posted 7.1% comparable store sales growth, including 4.3% transaction growth. Segment margin remained under pressure, falling to 9.9% from 11.6%, reflecting the cost of labor investment, product mix, tariffs, and elevated coffee pricing.
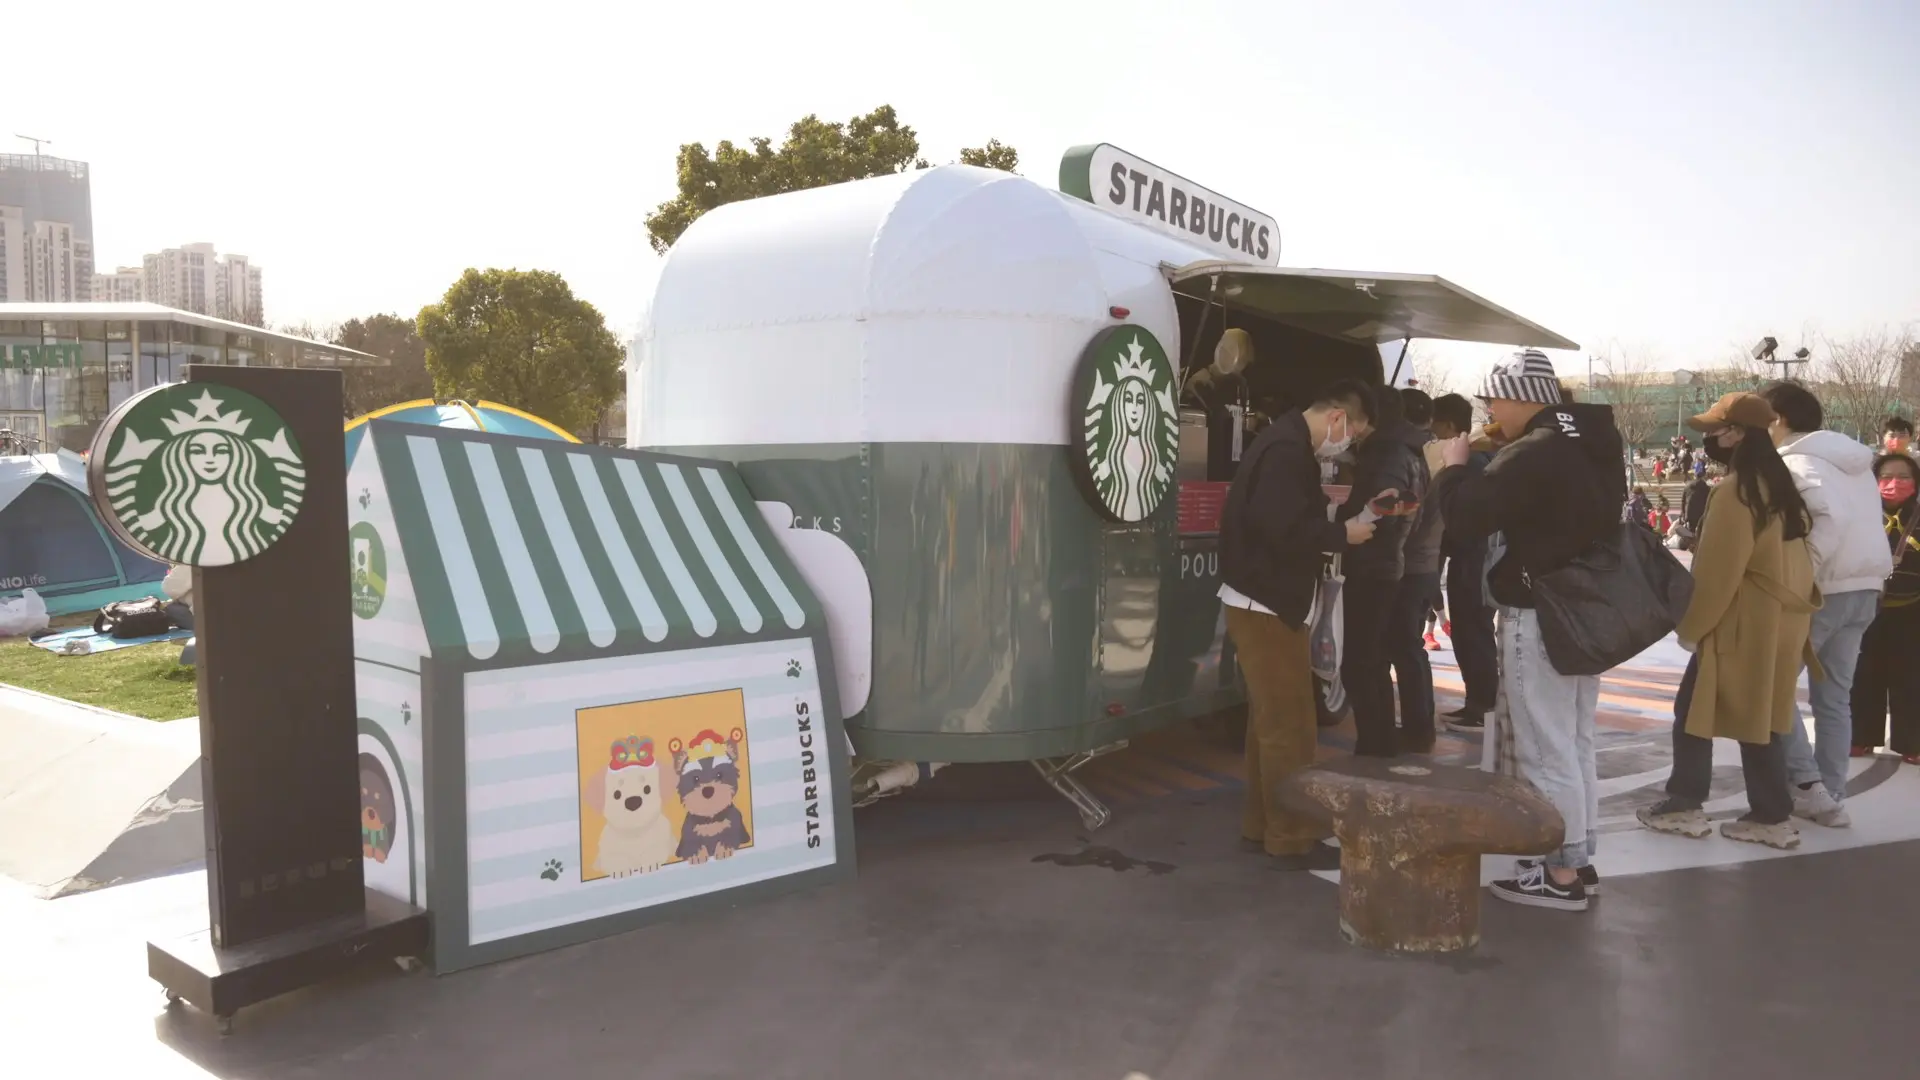
The International segment generated Q2 FY2026 revenue of $2.1 billion, up 10%, with comparable store sales growth of 2.6%. International operating margin expanded to 19.4%, helped by the accounting effect of China assets being classified as held for sale and the related halt in depreciation and amortization. China remains central to Starbucks’ global footprint, with 7,991 stores at quarter-end, second only to the U.S. market with 16,944 stores.
The China business is shifting toward a more capital-light structure. Starbucks closed its transaction with Boyu Capital for Starbucks retail operations in China, with Boyu acquiring up to 60% and Starbucks retaining 40% while continuing to own and license the brand and intellectual property. This reduces direct operating exposure in a competitive market and moves more of the China economics toward royalties, brand licensing, and retained equity participation.
Starbucks’ main competitive advantages are its global store base, premium brand positioning, high-frequency beverage usage, loyalty ecosystem, and control over the coffeehouse experience. Starbucks Rewards is a major demand engine, with the company stating that Rewards drove nearly 60% of U.S. company-operated revenue in fiscal 2025. The “Back to Starbucks” turnaround is focused on service speed, staffing, scheduling, marketing, menu innovation, partner investment, and store experience.
Direct competitors include Dunkin’, Dutch Bros, Tim Hortons, Costa Coffee, McDonald’s McCafé, Peet’s Coffee, Luckin Coffee in China, and local independent cafés. Compared with McDonald’s, Starbucks has a more coffee-focused premium positioning and a stronger specialty beverage identity, while McDonald’s has broader value pricing and larger global restaurant scale. Compared with Luckin Coffee in China, Starbucks has stronger global brand equity and store experience credentials, while Luckin competes aggressively on convenience, digital ordering, and price.
Starbucks holds a leading global position in specialty coffee retail. Its scale is difficult to match, with more than 41,000 stores and a footprint anchored by the U.S. and China, which together represented 61% of global stores in Q2 FY2026. The near-term investment case depends on whether the company sustains U.S. traffic recovery, stabilizes margins, and executes the China joint-venture transition without weakening brand control.

.webp)